01: THE CHALLENGE
Infrastructure data buried in layers
Municipalities managing aging water infrastructure faced a critical gap: risk maps showed where pipes were, but not why they were at risk. Maintenance decisions relied on manual layer toggling, slow, error-prone, and invisible to field teams.
P.01
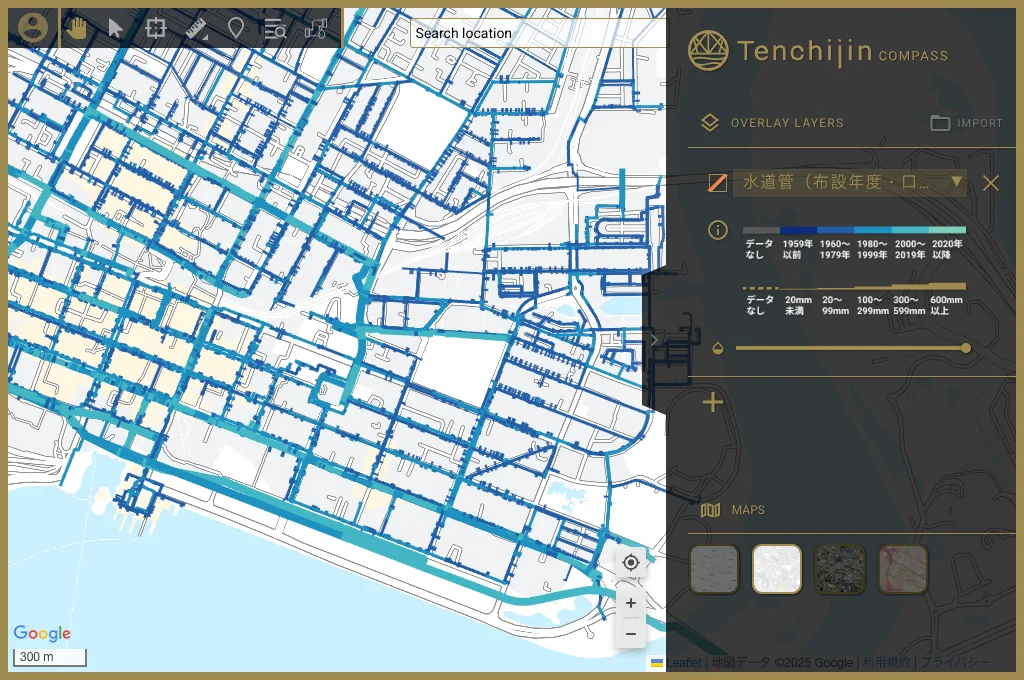
Layer overload
Separate attribute layers caused visual clutter and overlapping data. Engineers toggled between views rather than seeing the full picture at once.
P.02
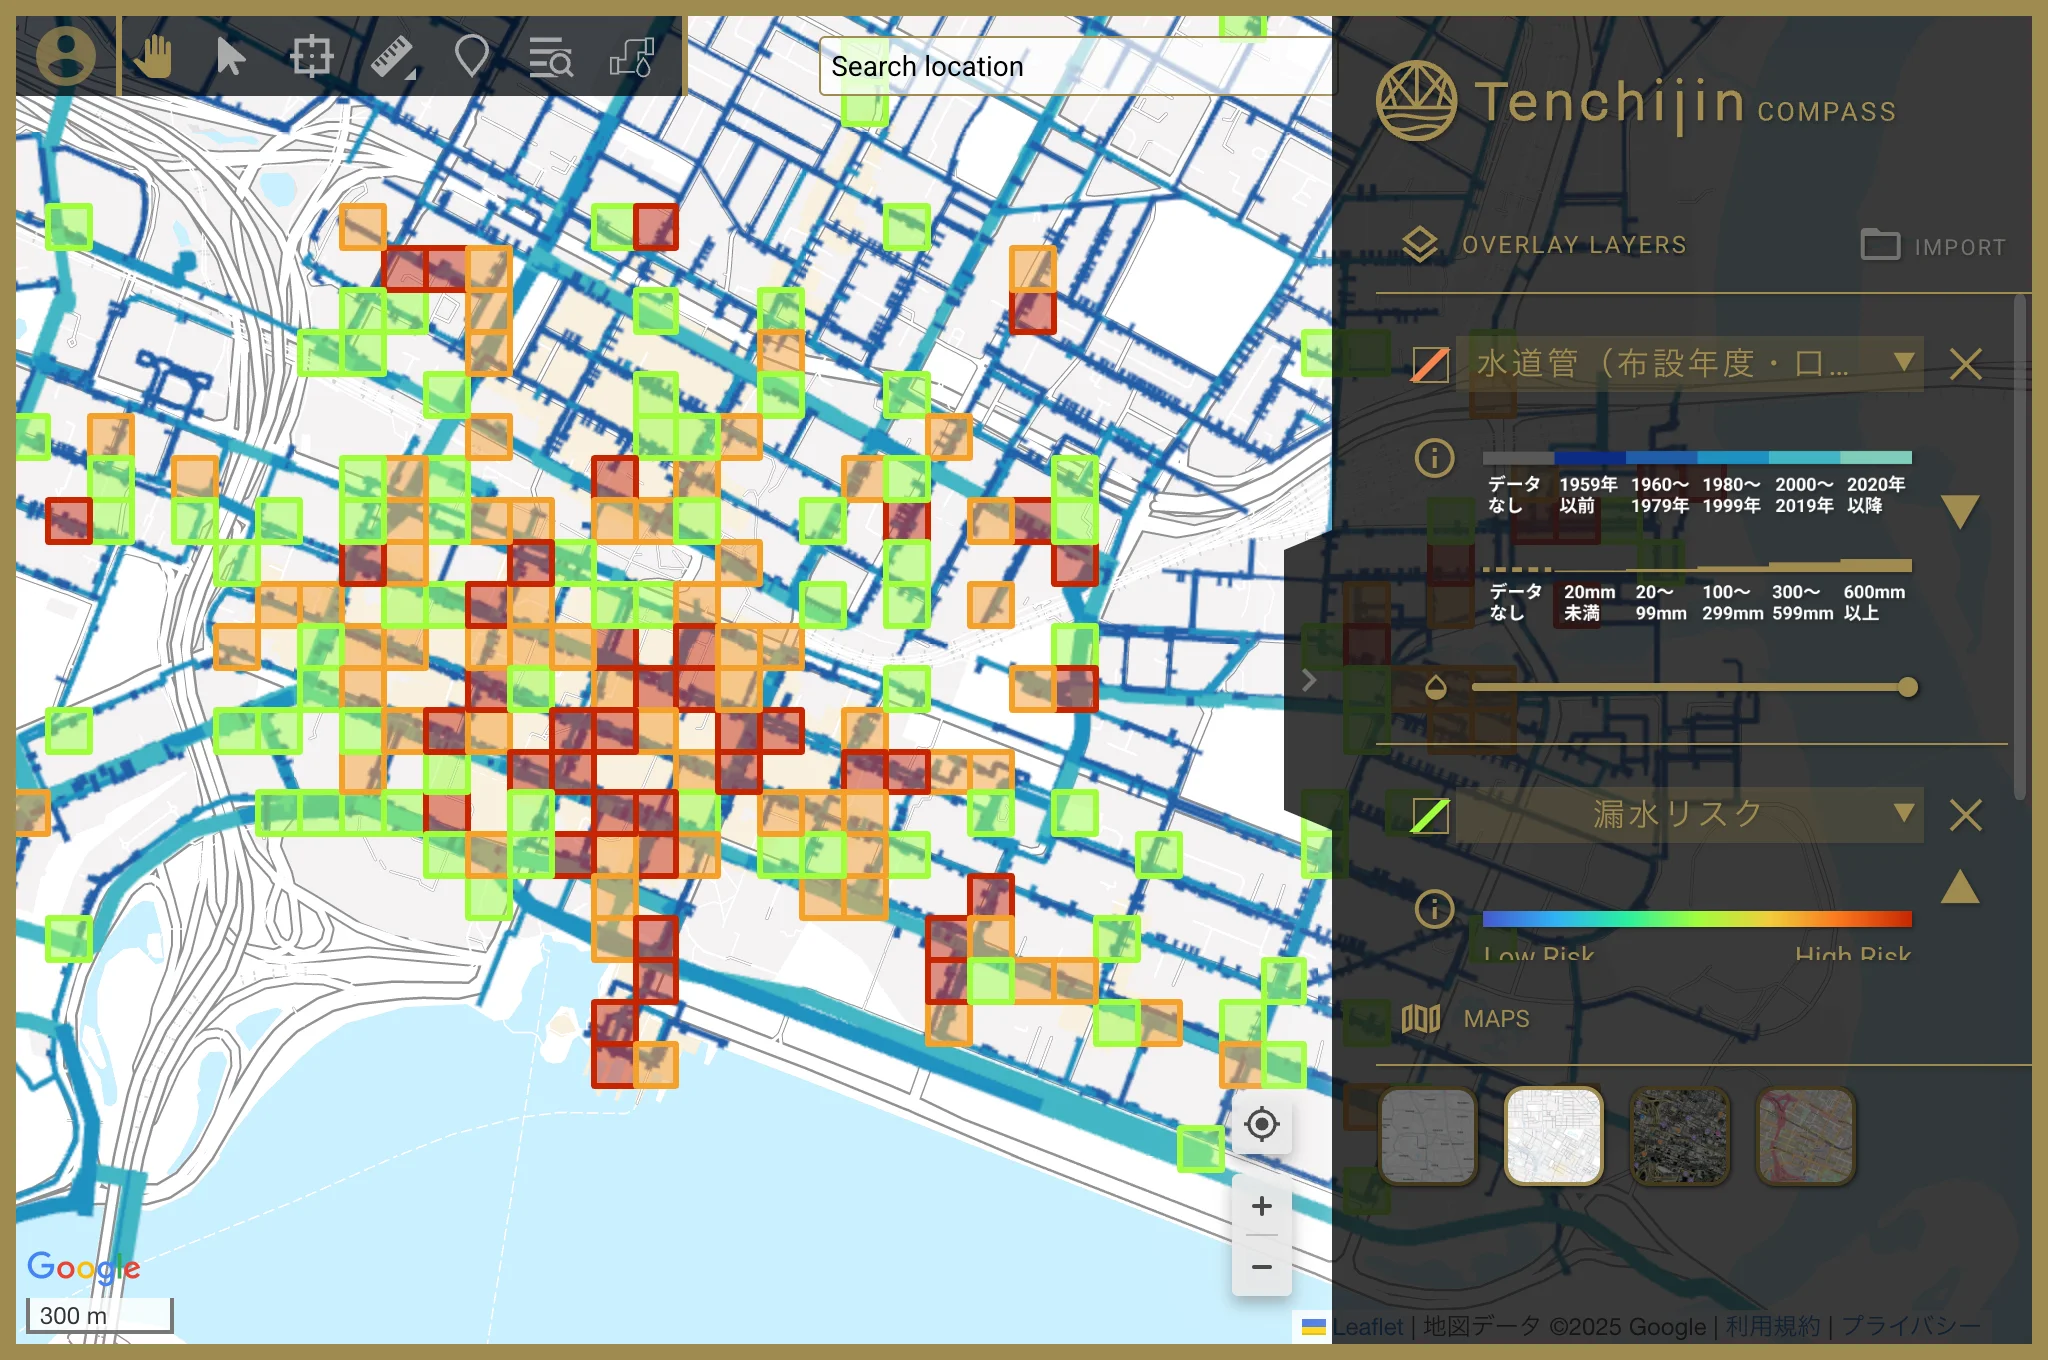
No contextual risk signal
Risk maps lacked pipe installation year and diameter, the two attributes that most directly explain why a section is flagged as high-risk.
P.03
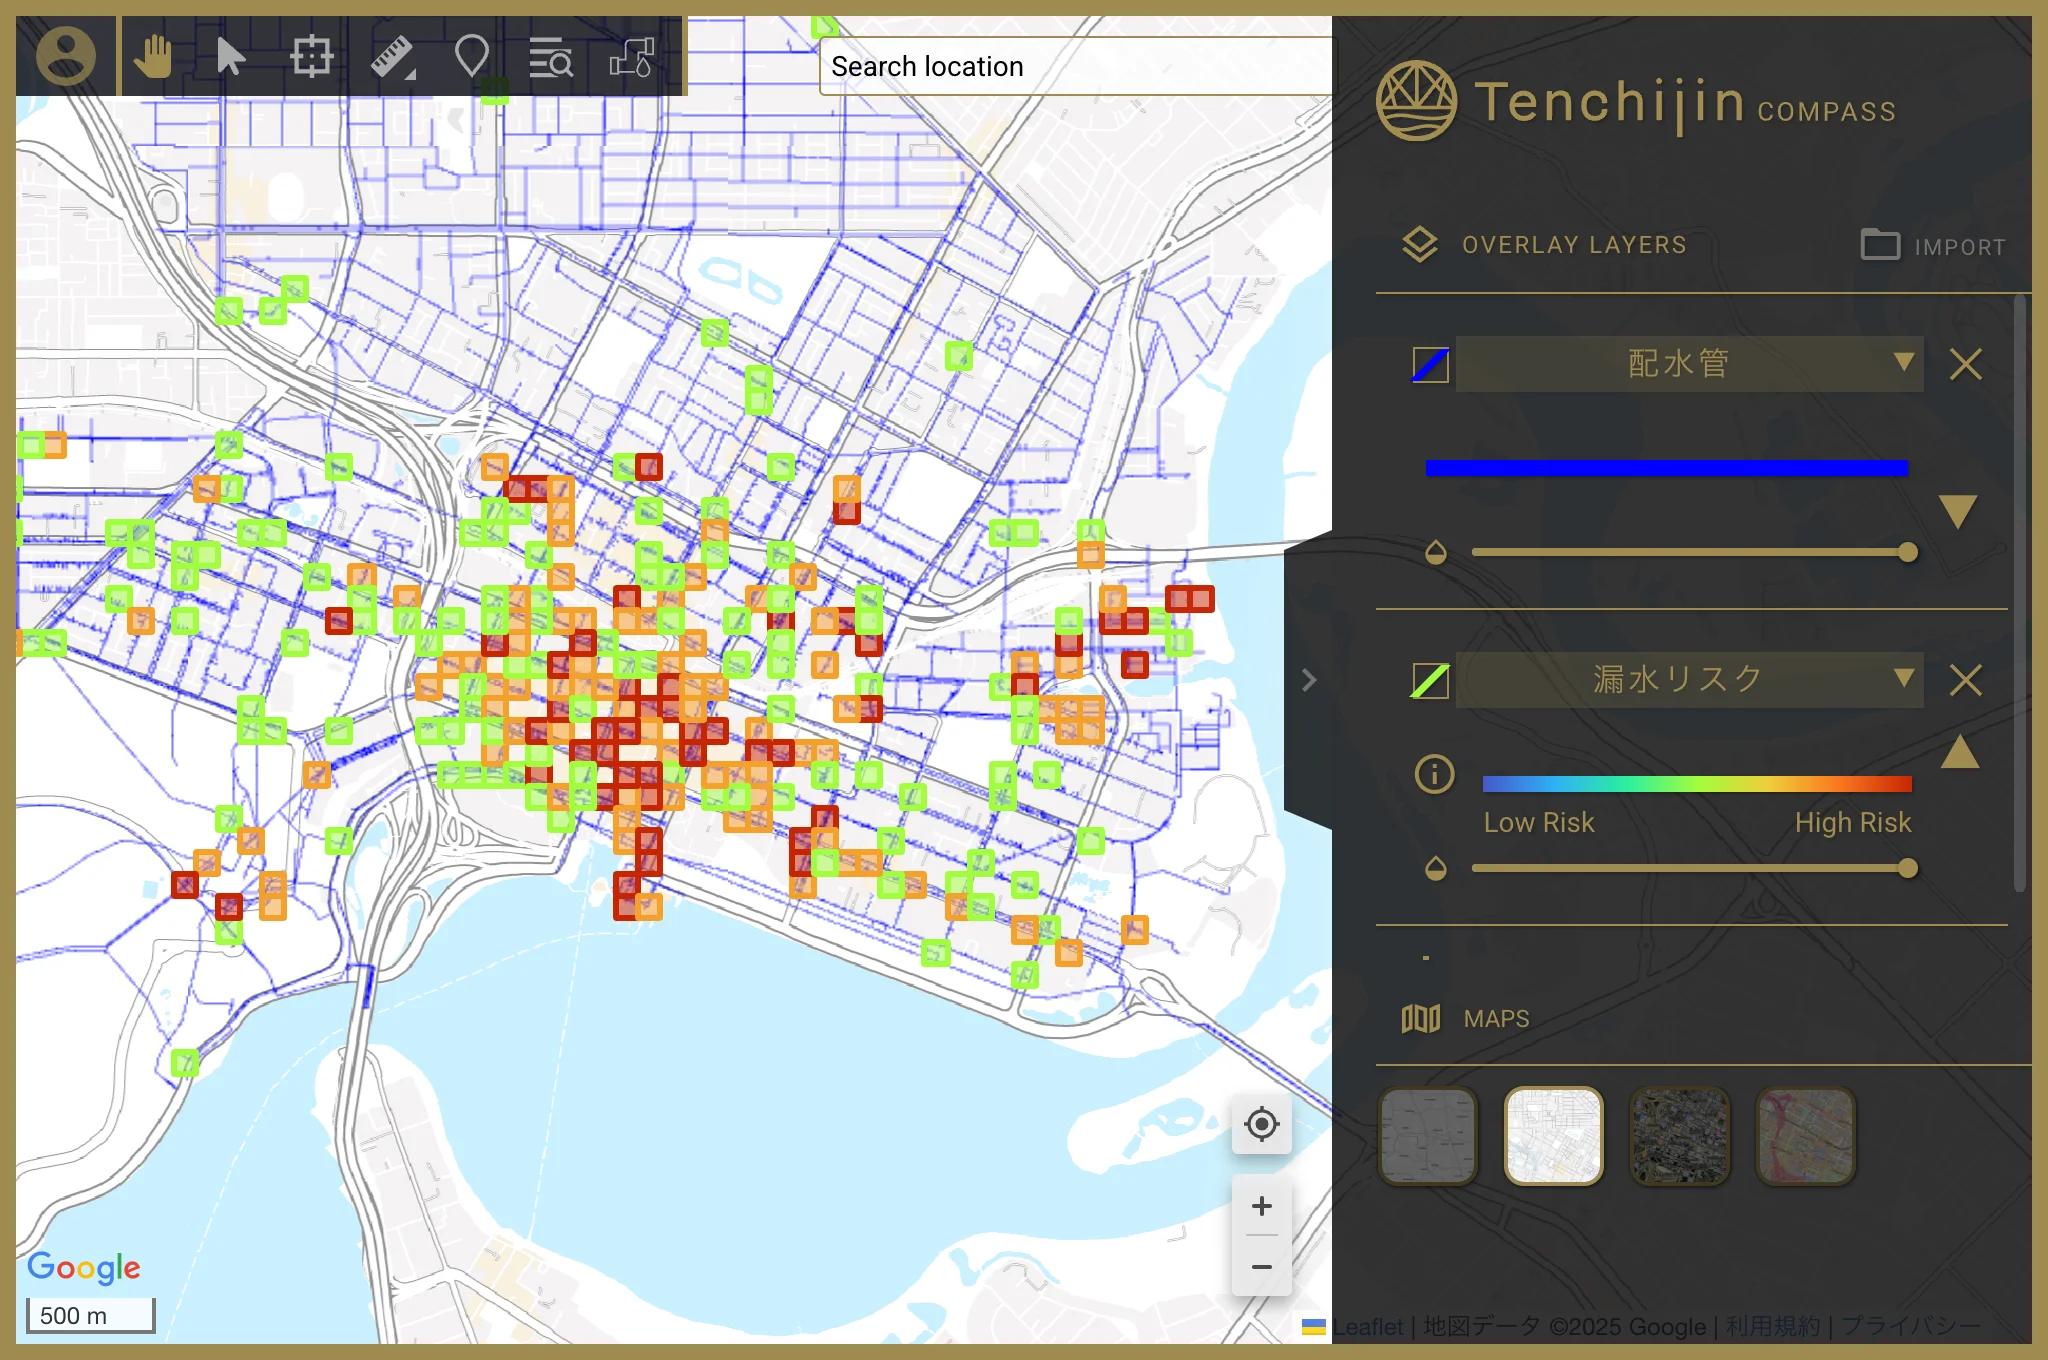
Reactive maintenance
Without clear multi-attribute context, inspection decisions were driven by complaints rather than proactive, data-informed prioritisation.